Sent to you by nunok via Google Reader:
What Frank Zappa's life has to do with e-waste, whale songs, and the black market for body parts.
 Much has been said about visual storytelling and how to tell stories of data in the information age, and there is no shortage of great books on data visualization. But count on Taschen to tackle a big conceptual challenge with a big, beautifully designed book: Information Graphics by art historian Sandra Rendgen explores the four key aspects of visualizing data — Location, Time, Category, and Hierarchy — through exemplary work from more than 200 projects, alongside essays by information architect and TED founder Richard Saul Wurman, Guardian Datablog editor Simon Rogers, Density Design's Paolo Ciuccarelli, and Rendgen herself.
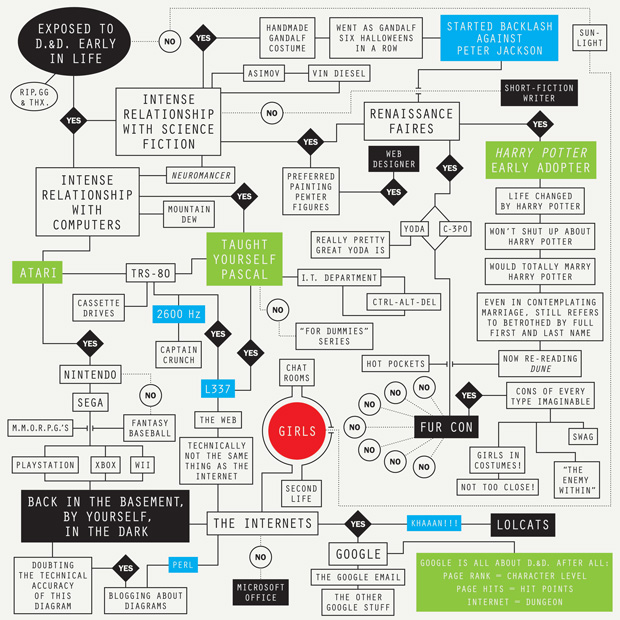
'Geek Love,' The New York Times, newspaper article, 2008
Exposed to Dungeons & Dragons Early in Life. Design: Sam Potts. Art Direction: Brian Rea
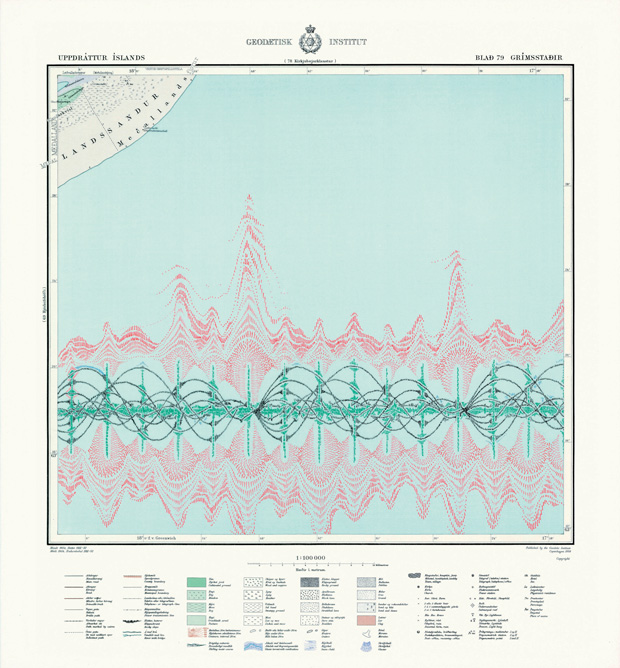
'Medallandssandur,' a blend of the sound specters form sonar and whale song. From a series of drawings, 2010
Design: Torgeir Husevaag. Article: Adam Rogers
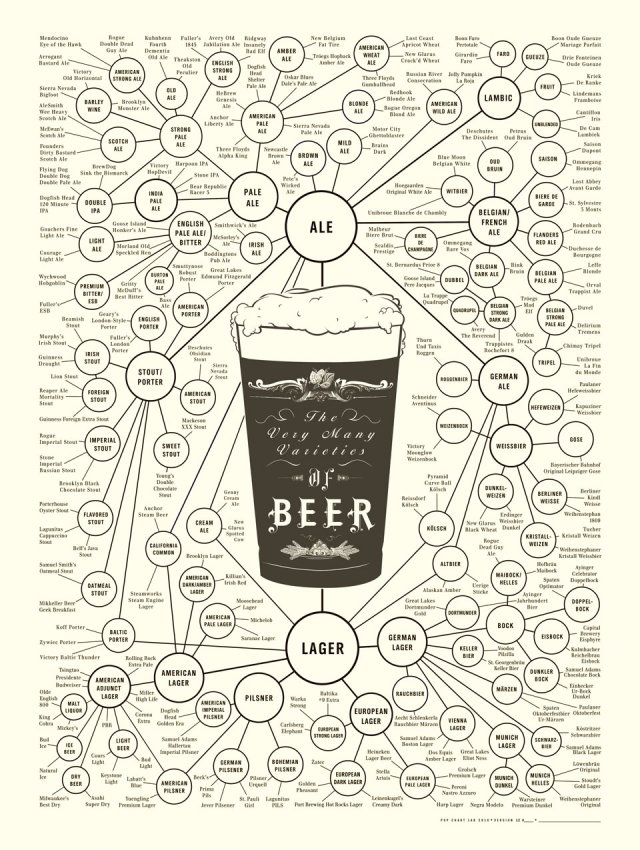
'The Very Many Varieties of Beer,' poster, 2010
Design: Ben Gibson, Patrick Mulligan (Pop Chart Lab)
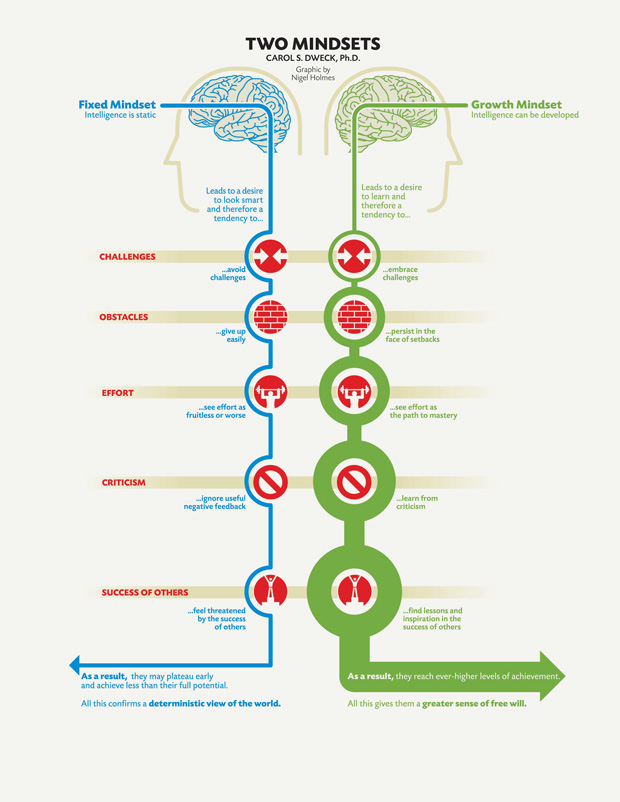
'Two Mindsets,' Stanford, magazine article, 2007
Data Source: Carol Dweck: 'Mindset: The New Psychology of Success', 2006. Design: Nigel Holmes

'Body Parts,' Esquire, magazine article, 2006
Design: Peter Grundy (Grundini). Art Direction: Alex Breuer
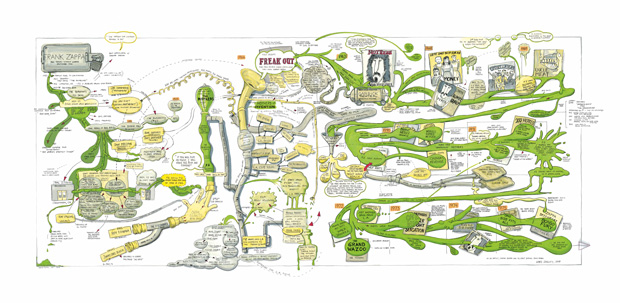
'Frank Zappa Chart,' painting, 2008
Artist: Ward Shelley (represented by Pierogi Gallery)
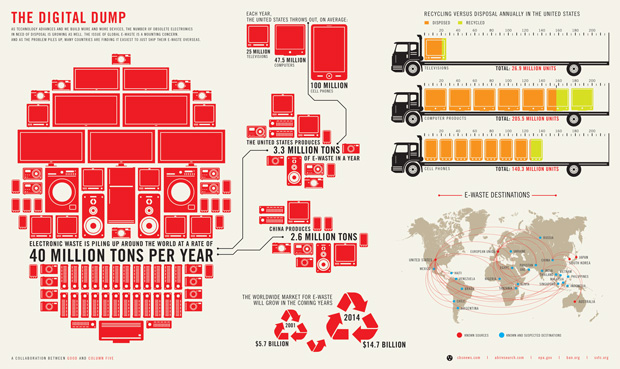
'The Growing E-Waste Situation,' GOOD, website, 2010
Data Source: CBS News; ABI Research; US EPA; Basel Action Network; Silicon Valley Toxics Coalition. Research: Brian Wolford. Design: Andrew Effendy (Column Five Media). Art Direction: Ross Crooks
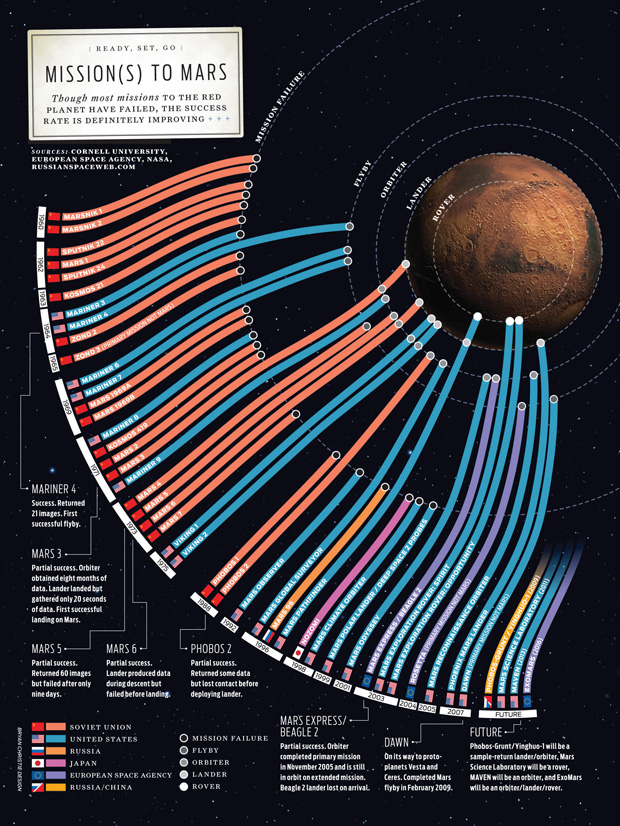
'Mission(s) to Mars,' IEEE Spectrum, magazine article, 2009
Data Source: Cornell University; European Space Agency; NASA; RussianSpaceWeb.com. Design: Bryan Christie, Joe Lertola. Art Direction: Mark Montgomery, Michael Solita
Information Graphics features work by a number of Brain Pickings favorites, including Stefanie Posavec, Nicholas Felton, Ward Shelley, Hans Rosling, Nathalie Miebach, David McCandless, Toby Ng, Michael Paukner, Christoph Niemann, Sam Potts, and Jonathan Harris. The cover image is, of course, the unmistakable Web Trend Map by Information Architects.
 Brain Pickings has a free weekly newsletter and people say it's cool. It comes out on Sundays and offers the week's best articles. Here's what to expect. Like? Sign up.

Brain Pickings takes 450+ hours a month to curate and edit across the different platforms, and remains banner-free. If it brings you any joy and inspiration, please consider a modest donation – it lets me know I'm doing something right. 
Things you can do from here:
- Subscribe to Brain Pickings using Google Reader
- Get started using Google Reader to easily keep up with all your favorite sites
No comments:
Post a Comment